Medical icons

Opioid-Related Emergency Department Visits at a Glance


Release date: April 2018


Highlights

  • This report demonstrates the burden of opioid use on the health system by examining the rates of opioid-related emergency department (ED) visits in Durham Region residents.
  • In 2016, there were 488 opioid-related ED visits in Durham Region residents. ED visit rates were higher in males than females. Rates generally increased since 2007 with the exception of a slight decline in 2012-2013 which coincided with the delisting of OxyContin in 2012.
  • The ED visit rates are highest in adults aged 20-34 years. In 2016, this young adult group accounted for 37 per cent (181 of 488) of the ED visits.
  • In 2016, heroin poisoning accounted for 14 per cent of the ED visits (main problem diagnosis only). Heroin poisoning, as a percentage of the total ED visits, has steadily increased since 2012 while the percentage of ED visits due to mental and behavioural disorders has declined from 60 per cent of the main problem diagnoses in 2012 to 42 per cent by 2016. The percentage of ED visits due to poisoning from prescription opioids, whether obtained from illegitimate sources or from a risky pattern of use, has remained constant.

Figure 1. Age-standardized opioid-related ED visit rate per 100,000 in Durham Region and Ontario, by sex, between 2007 and 2016.

Opioid-related ED visit rate per 100,000 in Durham Region and Ontario, by sex.

Table 1. Counts and age-standardized opioid-related ED visit rates per 100,000 in Durham Region and Ontario, by sex, between 2007 and 2016.

Statistic Calendar year
2007 2008 2009 2010 2011 2012 2013 2014 2015 2016
Durham Region Females rate 39.7 39.8 54.8 53.0 59.1 59.7 51.0 49.7 63.7 63.0
Durham Region Females count 118 120 167 164 187 190 166 164 212 212
Durham Region Males rate 37.6 48.2 73.7 51.2 83.8 64.1 61.3 71.7 61.0 85.9
Durham Region Males count 113 143 214 152 250 196 190 222 197 276
Ontario Females rate 41.1 47.1 57.9 63.4 64.8 62.2 57.9 55.0 61.0 70.2
Ontario Females count 2,678 3,096 3,819 4,228 4,355 4,229 3,976 3,816 4,257 4,958
Ontario Males rate 51.4 63.5 79.5 83.1 85.3 83.2 73.8 76.3 84.5 103.6
Ontario Males count 3,311 4,089 5,109 5,389 5,579 5,496 4,916 5,129 5,704 7,075

Source: Ambulatory Visits, Ontario Ministry of Health and Long-Term Care, intelliHEALTH Ontario

Figure 2. Age-specific opioid-related ED visit rates per 100,000 in Durham Region and Ontario, ages 15 to 19 and 20 to 34, between 2007 and 2016.

Opioid-related ED visit rates per 100,000 in Durham Region and Ontario, ages 15 to 19 and 20 to 34.

Table 2. Counts and age-specific opioid-related ED visit rates per 100,000 for Durham Region and Ontario, ages 15 to 19, and 20 to 34, between 2007 and 2016

Statistic Calendar year
2007 2008 2009 2010 2011 2012 2013 2014 2015 2016
Durham Region 15-19 Rate 47.1 45.9 30.9 24.6 53.3 45.6 25.4 41.2 73.1 38.6
Durham Region 15-19 Count 22 22 15 12 26 22 12 19 33 17
Durham Region 20-34 Rate 66.6 73.0 117.3 107.2 146.2 104.9 116.6 107.0 112.3 133.9
Durham Region 20-34 Count 75 83 135 126 175 129 147 138 148 181
Ontario 15-19 Rate 41.4 49.7 57.1 71.6 81.8 69.4 52.9 51.4 53.4 56.8
Ontario 15-19 Count 364 441 509 641 734 617 464 443 451 474
Ontario 20-34 Rate 82.1 98.1 126.6 148.7 163.4 153.1 139.4 136.5 146.9 183.5
Ontario 20-34 Count 2,116 2,540 3,303 3,933 4,380 4,188 3,878 3,854 4,191 5,353

Source: Ambulatory Visits, Ontario Ministry of Health and Long-Term Care, intelliHEALTH Ontario

Figure 3. Age-specific opioid-related ED visit rates per 100,000 in Durham Region and Ontario, ages 35 to 64 and 65 years and older, between 2007 and 2016.

Opioid-related ED visit rates per 100,000, ages 35 to 64 and 65 years and older.

Table 3. Counts and age-specific opioid-related ED visit rates per 100,000 for Durham Region and Ontario, ages 35 to 64, and 65 and older, between 2007 and 2016

Statistic Calendar year
2007 2008 2009 2010 2011 2012 2013 2014 2015 2016
Durham Region 35-64 Rate 46.1 51.5 73.2 57.1 72.5 69.6 59.9 65.8 66.7 84.2
Durham Region 35-64 Count 118 134 193 153 196 190 165 183 187 238
Durham Region 65+ Rate 11.1 24.4 38.2 22.5 32.3 45.8 26.5 42.6 36.4 40.1
Durham Region 65+ Count 7 16 26 16 24 36 22 37 33 38
Ontario 35-64 Rate 57.1 67.5 81.2 78.7 75.0 74.4 68.7 68.5 78.9 92.7
Ontario 35-64 Count 3,074 3,679 4,467 4,371 4,200 4,186 3,878 3,886 4,491 5,309
Ontario 65+ Rate 17.6 20.1 24.2 26.1 23.9 28.4 24.2 27.0 28.2 29.5
Ontario 65+ Count 297 349 432 479 452 561 499 578 625 676

Source: Ambulatory Visits, Ontario Ministry of Health and Long-Term Care, intelliHEALTH Ontario

Figure 4. Age-specific opioid-related ED visit rates per 100,000 in Durham Region and Ontario, females of reproductive age (15 to 49 years), between 2007 and 2016.

Opioid-related ED visit rates per 100,000, females of reproductive age (15 to 49 years).

Table 4. Counts and age-specific opioid-related ED visit rates per 100,000 for Durham Region and Ontario, females of reproductive age (15 to 49 years) between 2007 and 2016

Statistic Calendar year
2007 2008 2009 2010 2011 2012 2013 2014 2015 2016
Durham Region Females 15-49 Rate 52.0 52.2 74.2 75.0 81.4 71.9 70.0 67.7 90.4 83.1
Durham Region Females 15-49 Count 81 82 117 119 129 114 111 107 143 132
Ontario Females 15-49 Rate 63.6 71.2 85.1 98.2 102.2 96.3 88.2 82.6 91.6 110.6
Ontario Females 15-49 Count 2,058 2,312 2,769 3,202 3,335 3,147 2,882 2,693 2,979 3,622

Source: Ambulatory Visits, Ontario Ministry of Health and Long-Term Care, intelliHEALTH Ontario

Figure 5. Per cent of main problem diagnosis codes, by diagnosis category, in Durham Region and Ontario between 2007 and 2016.

Per cent of main problem diagnosis codes, by diagnosis category, in Durham Region and Ontario.

Table 5. Count and per cent of main problem diagnosis codes, by diagnosis category, in Durham Region and Ontario between 2007 and 2016

Location Diagnosis Category Calendar year
2007 2008 2009 2010 2011 2012 2013 2014 2015 2016
Durham Region Illegal 1.3 1.1 0 0.8 0.6 1.1 1.5 6.5 9.1 13.7
MBD 56.7 60.6 60.1 62.2 66.0 59.9 56.4 49.2 43.2 42.2
Prescription 42.0 38.3 39.9 37.0 33.3 39.0 42.1 44.2 47.7 44.1
Ontario Illegal 1.4 1.4 1.3 1.6 1.4 2.3 2.5 5.2 5.8 7.9
MBD 61.4 65.6 66.5 71.3 71.5 67.9 64.5 61.6 61.9 58.8
Prescription 37.2 33.0 32.2 27.1 27.1 29.8 33.0 33.2 32.3 33.3

Source: Ambulatory Visits, Ontario Ministry of Health and Long-Term Care, intelliHEALTH Ontario

Data sources

ED visit data are collected by the Canadian Institute for Health Information (CIHI) on a fiscal year basis. For ED visits, the main diagnostic code is the “main problem” (MP) that is deemed to be the clinically significant reason for the visit. ED visit data provide only a crude measure of the burden of opioid use. Data are influenced by factors that are unrelated to health status such as availability and accessibility of care, administrative policies and hospital procedures. This may influence comparisons between areas and over time.

For all indicators, data were analyzed by the residence of the patient, not where the ED visit occurred. Ontario residents treated outside of the province were excluded. Data were reported by calendar year, based on year of the ED visit. This report includes ED visit indicators with relevance to public health programming.

Opioid-related ED visits were selected using ICD-10-CA codes T40 (.0 -.4, .6) (i.e., poisoning) and F11 (.0-.9) (i.e., mental and behavioural disorders due to acute intoxication, harmful use, dependence, etc. due to the use of opioids) whether it was the MP or a comorbidity. As such, the counts and rates included in this report are higher than the information presented by Public Health Ontario – Interactive Opioid Tool. Visits where the health care provider documented uncertainty in the diagnosis (diagnosis prefix Q) and visits which resulted in a transfer to another ambulatory care facility were included in the counts. ED visits for mental and behavioural disorders due to multiple drug use (F19) were excluded. Multiple codes can exist for each ED visit. As such, a unique visit number, NACRS key, was used to count the number of visits where at least one of the above codes was captured as the main problem or comorbidity.

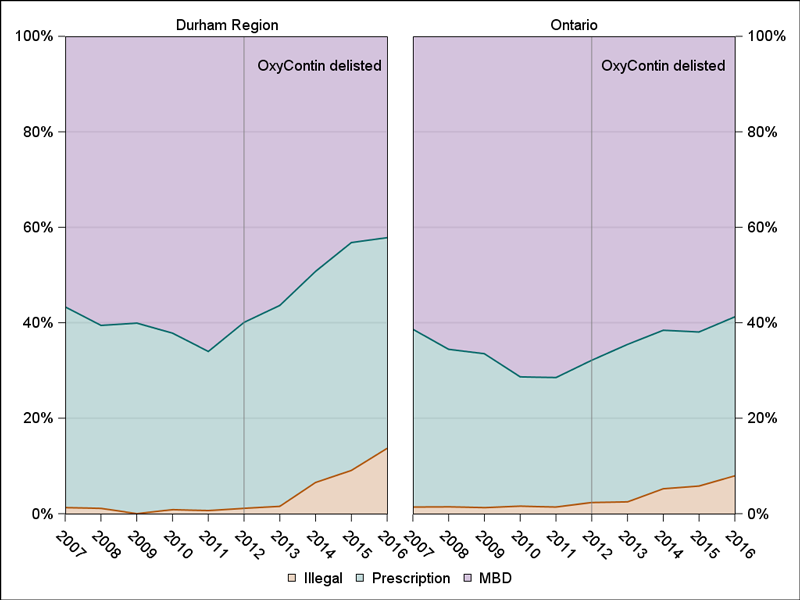
In Figure 3, only MP codes were included in the denominator. Diagnosis categories were defined using the following codes: illegal T40 (.0 and .1); prescription T40 (.2-.4, .6); and mental and behavioural disorders (MBD) F11 (.0-.9). Opioid-related ED visits within the prescription category can occur when prescription drugs are obtained from illegitimate sources or from a risky pattern of use (excluding under use) such as deviating from acceptable practice or using for purposes that are not therapeutic.

Definitions

Figures and tables are provided for the following indicators:

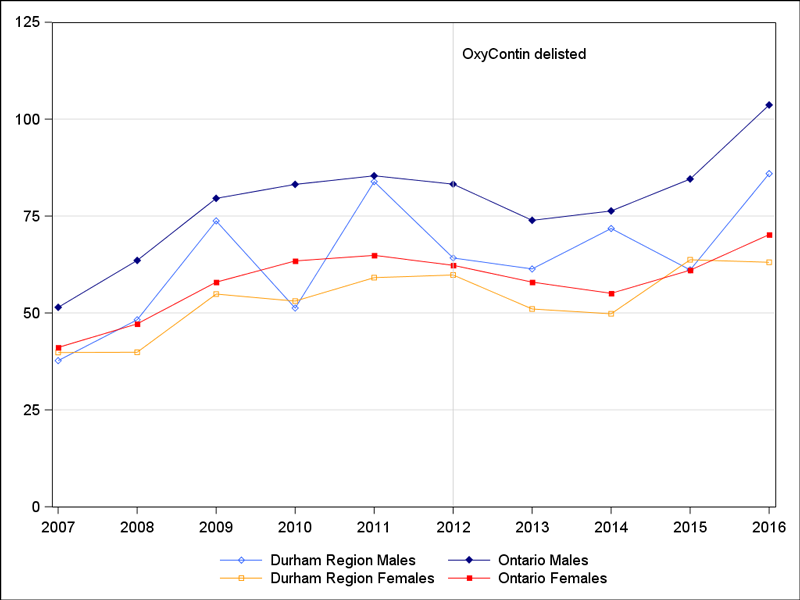
  • Age-standardized opioid-related ED visit rates by sex
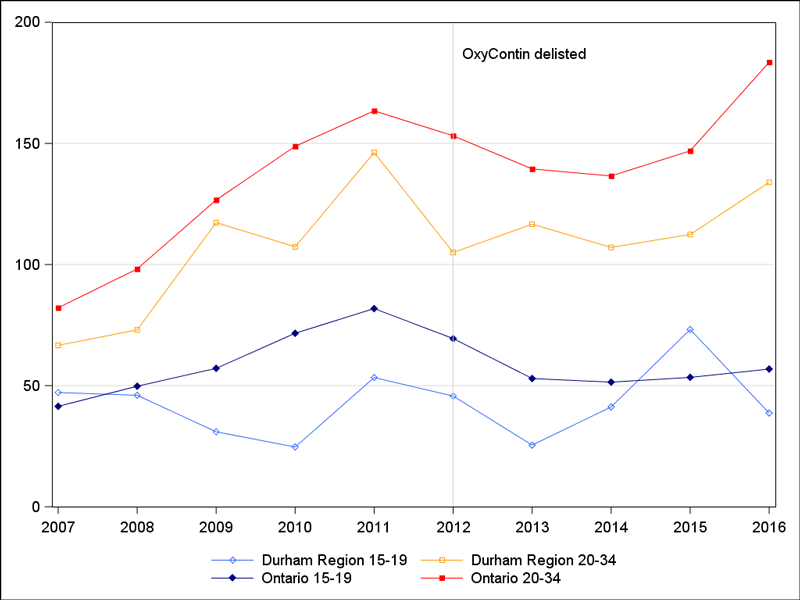
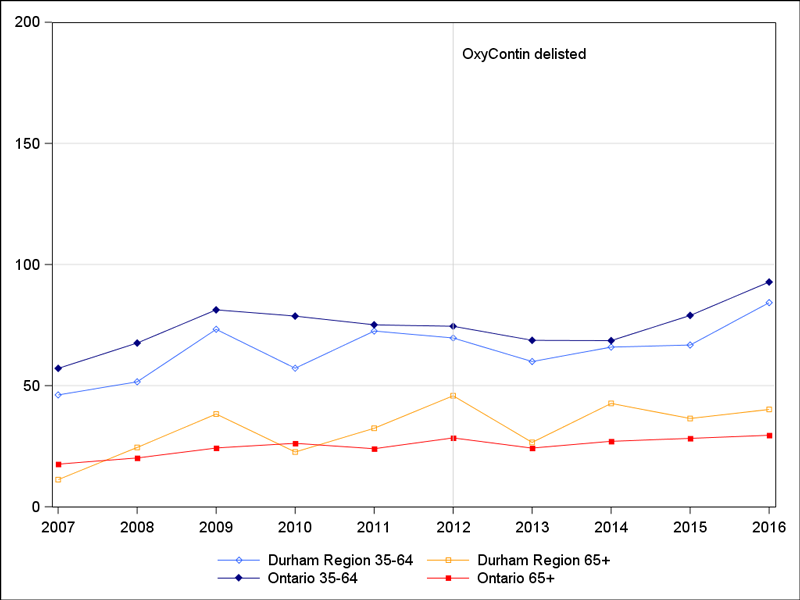
  • Age-specific opioid-related ED visits rates in individuals aged 15 to 19 years , 20 to 34 years, 35 to 64 years, 65 years and older

Age-standardized ED visit rate

An age-standardized ED visit rate is the number of ED visits per 100,000 that would occur if the population had the same age distribution as the 2011 Canadian population. This rate provides a single summary number that allows populations with different age compositions to be compared.

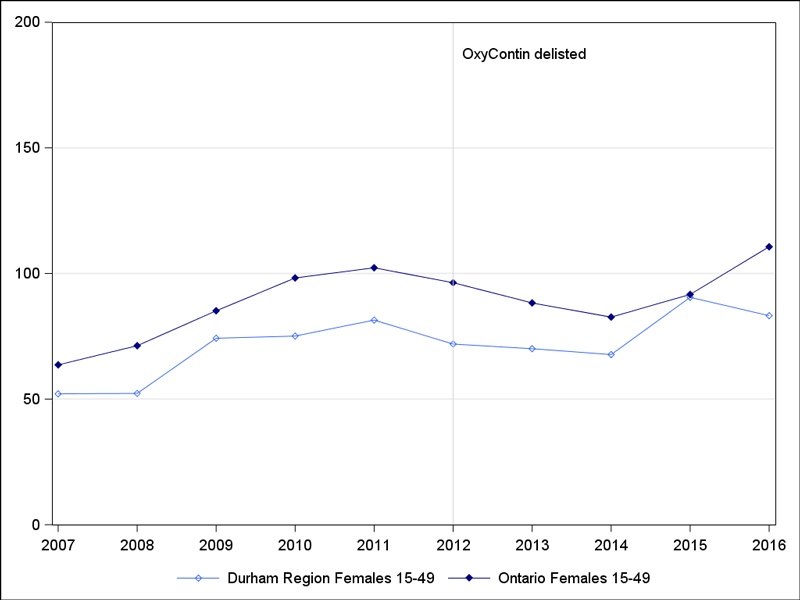
Age-specific ED visit rate

This rate is the total number of ED visits in a specified age group per 100,000 population in that age group. The numerator and denominator refer to the same age group.

Contact us

Health Department
The Regional Municipality of Durham
605 Rossland Road East
Whitby, Ontario L1N 6A3
Telephone (within regional limits): 311
Fax: 905-666-6214
Email the Health Department
Map this location

Sign up to our Newsletter

Stay up to date on the Region's activities, events, programs and operations by subscribing to our eNewsletters.