Emergency department related icons

Pedestrian-related emergency department visits at a glance


Release date: July 2018


Highlights

  • This report demonstrates the burden of pedestrian injuries by examining the rates of pedestrian-related emergency department (ED) visits in Durham Region residents.
  • The rates of pedestrian-related ED visits have remained unchanged in the 10-year period between 2008 and 2017. In 2017, there were 318 pedestrian-related ED visits in Durham Region residents. About one-third of the ED visits occurred between September and November (98/318), and between the hours of 6 and 9 pm (93/318).
  • The pedestrian-related ED visit rates were consistently lower in females than males, and Durham Region’s rates were lower than the provincial rates.
  • The highest rates occur in youth and young adults aged 15 to 19 and 20 to 24 years. The age-specific rates have remained stable over the past 10 years, respectively. Between 2008 and 2017, there were, on average, 44 ED visits in Durham Region youth and 35 ED visits in young adults each year for pedestrian-related injuries
  • Most (83%) pedestrian-related ED visits involved collisions with motor vehicles. Almost half (47%) of these were traffic-related injuries that is, pedestrians injured in collisions with motor vehicles on public roads.

Figure 1: Age-standardized pedestrian-related ED visit rates per 100,000 in Durham Region and Ontario, by sex, between 2008 and 2017

Age-standardized pedestrian-related ED visit rates per 100,000 in Durham Region and Ontario

Table 1: Counts and age-standardized pedestrian-related emergency department visit rates per 100,000 in Durham Region and Ontario, by sex, between 2008 and 2017

Statistic Calendar year
2008 2009 2010 2011 2012 2013 2014 2015 2016 2017
Durham Region Females rate 38.3 36.2 41.2 47.5 49.1 48.9 37.7 36.2 37.8 43.5
Durham Region Females count 116 113 133 152 159 161 126 122 129 151
Durham Region Males rate 46.1 45.8 46.3 54.5 51.3 48.4 49.0 48.4 51.2 49.4
Durham Region Males count 141 144 144 174 159 151 159 159 169 167
Ontario Females rate 47.1 46.8 49.3 51.8 48.4 50.7 47.1 48.8 50.4 47.3
Ontario Females count 3,086 3,097 3,301 3,497 3,310 3,507 3,282 3,423 3,580 3,410
Ontario Males rate 51.6 50.9 52.6 53.2 52.1 48.9 49.3 52.4 54.1 53.0
Ontario Males count 3,293 3,260 3,407 3,482 3,447 3,263 3,327 3,558 3,730 3,720

Source: Ambulatory Visits, Ontario Ministry of Health and Long-Term Care, intelliHEALTH Ontario

Figure 2: Age-specific pedestrian-related ED visit rates per 100,000 in Durham Region and Ontario individuals aged 0 to 14 and 15 to 19, between 2008 and 2017

Age-specific pedestrian-related ED visit rates per 100,000 in Durham Region and Ontario

Table 2: Counts and age-specific pedestrian-related ED visit rates per 100,000 in Durham Region and Ontario individuals aged 0 to 14 and 15 to 19, between 2008 and 2017

Statistic Calendar year
2008 2009 2010 2011 2012 2013 2014 2015 2016 2017
Durham Region 0-14 Rate 16.3 19.1 13.9 24.5 11.4 25.5 13.2 14.8 11.2 21.4
Durham Region 0-14 Count 19 22 16 28 13 29 15 17 13 25
Durham Region 15-19 Rate 102.4 113.4 127.4 112.8 101.7 91.1 86.7 99.8 111.4 73.3
Durham Region 15-19 Count 49 55 62 55 49 43 40 45 49 32
Ontario 0-14 Rate 18.7 17.6 18.0 18.4 17.6 17.8 14.2 15.3 15.2 14.3
Ontario 0-14 Count 418 392 399 406 388 392 312 337 339 321
Ontario 15-19 Rate 106.7 93.7 102.4 101.5 94.5 86.8 92.4 98.8 96.6 94.6
Ontario 15-19 Count 946 835 917 911 840 761 796 835 806 791

Source: Ambulatory Visits, Ontario Ministry of Health and Long-Term Care, intelliHEALTH Ontario

Figure 3: Age-specific pedestrian-related ED visit rates per 100,000 in Durham Region and Ontario individuals aged 20 to 24 and 25 to 44, between 2008 and 2017

Table 3: Counts and age-specific pedestrian-related ED visit rates per 100,000 in Durham Region and Ontario individuals aged 20 to 24 and 25 to 44, between 2008 and 2017

Statistic Calendar year
2008 2009 2010 2011 2012 2013 2014 2015 2016 2017
Durham Region 20-24 Rate 77.7 76.2 71.8 93.0 71.0 76.7 91.5 94.8 87.9 80.2
Durham Region 20-24 Count 31 31 30 40 32 36 44 46 43 39
Durham Region 25-44 Rate 39.5 35.3 37.9 48.4 53.0 47.8 38.5 44.9 47.4 47.3
Durham Region 25-44 Count 67 59 63 80 88 80 65 77 83 85
Ontario 20-24 Rate 80.8 80.2 83.8 96.6 84.9 85.0 84.8 82.3 84.5 80.6
Ontario 20-24 Count 712 712 758 890 802 820 828 806 839 817
Ontario 25-44 Rate 45.8 46.1 47.9 49.4 49.3 49.2 49.0 50.9 53.9 51.1
Ontario 25-44 Count 1,674 1,667 1,724 1,776 1,787 1,793 1,794 1,874 2,018 1,953

Source: Ambulatory Visits, Ontario Ministry of Health and Long-Term Care, intelliHEALTH Ontario

Figure 4: Per cent of pedestrian-related ED visit codes, by nature of injury, in Durham Region and Ontario between 2008 and 2017

Per cent of pedestrian-related ED visit codes, by nature of injury, in Durham Region and Ontario

Table 4: Per cent of pedestrian-related ED visit codes, by nature of injury, in Durham Region and Ontario between 2008 and 2017

Location Collision type Calendar year
2008 2009 2010 2011 2012 2013 2014 2015 2016 2017
Durham Region MVA -- Non-traffic 16.0 13.6 16.6 13.5 13.8 14.7 15.8 18.5 20.8 19.5
MVA -- Traffic 53.7 55.6 46.9 55.5 52.5 52.6 50.5 47.7 45.0 47.5
MVA -- Unspecified 24.1 15.2 20.2 16.3 17.6 17.6 20.0 16.0 22.1 15.7
Other 6.2 15.6 16.2 14.7 16.0 15.1 13.7 17.8 12.1 17.3
Ontario MVA -- Non-traffic 13.4 14.4 15.0 13.7 13.0 14.3 14.8 14.3 13.3 14.0
MVA -- Traffic 55.3 54.9 55.6 56.5 57.1 56.4 56.8 57.6 59.4 59.1
MVA -- Unspecified 12.1 11.3 11.6 12.1 11.8 11.7 11.3 9.8 9.0 8.7
Other 19.3 19.4 17.7 17.7 18.1 17.6 17.0 18.4 18.3 18.2

Source: Ambulatory Visits, Ontario Ministry of Health and Long-Term Care, intelliHEALTH Ontario

Data sources

ED visit data are collected by the Canadian Institute for Health Information (CIHI) on a fiscal year basis. The main diagnostic code is the “main problem” (MP). A second set of codes, external cause codes (e-codes) are used to classify the environmental events, circumstances and conditions that cause an injury (i.e. pedestrian injured in a collision with a car or van). external cause codes are not used as a MP so need to be examined separately. Multiple external cause codes can exist for each visit. The counts shown for groupings of external cause codes (i.e. ICD-10 codes V01-V09) are actually counts of e-codes; not counts of ED visits.

ED visit data provide only a crude measure of the burden of pedestrian injuries. Data are influenced by factors that are unrelated to health status such as availability and accessibility of care, administrative policies and hospital procedures. This may influence comparisons between areas and over time.

For all indicators, data were analyzed by the residence of the patient, not where the ED visit occurred. Ontario residents treated outside of the province were excluded. Data were reported by calendar year, based on the year of the ED visit. This report includes ED visit indicators with relevance to public health programming.

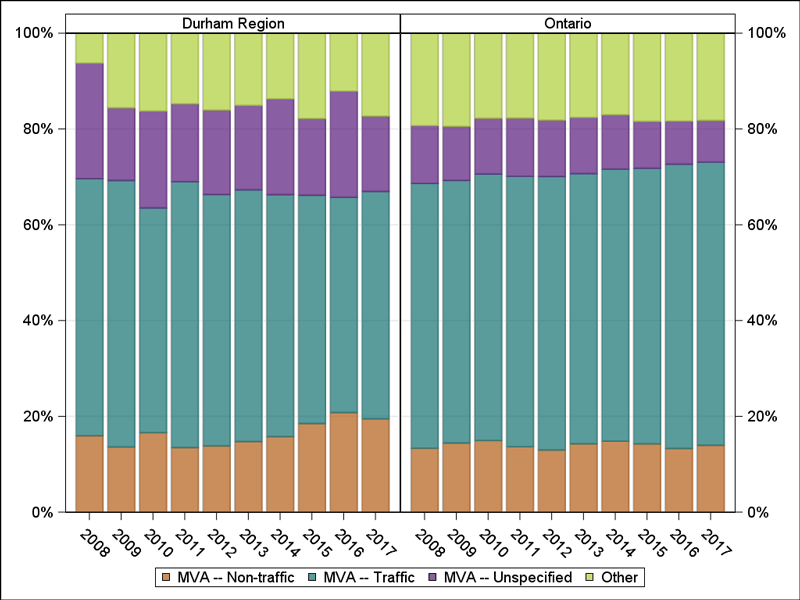
Pedestrian-related ED visits were selected using ICD-10-CA codes V01 – V09.  ED visits that resulted in a transfer to another ambulatory care facility were included in the counts. In Figure 4, e-code categories were defined using the following codes: MVA-traffic V03 (.1), MVA-non-traffic V03 (.0), MVA-unspecified V03 (.9) and other.

Definitions

Figures and tables are provided for the following indicators:

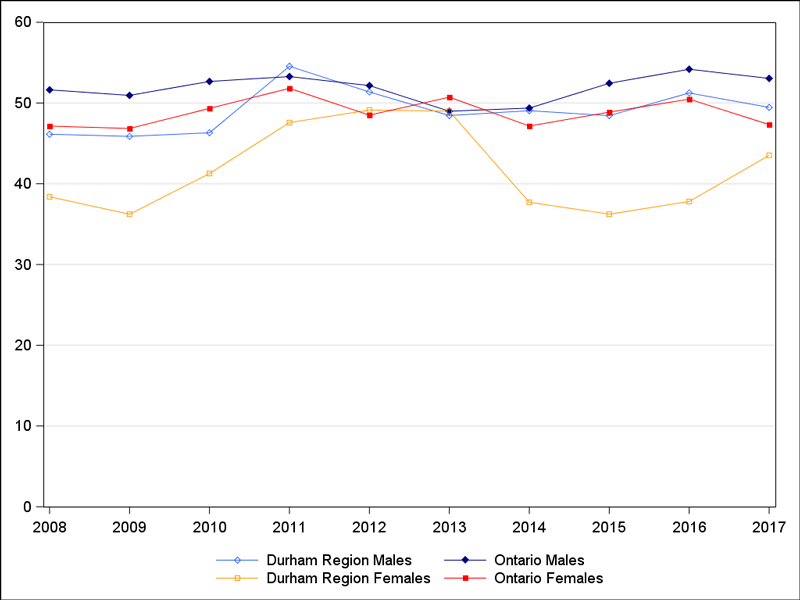
  • Age-standardized pedestrian-related ED visit rates by sex
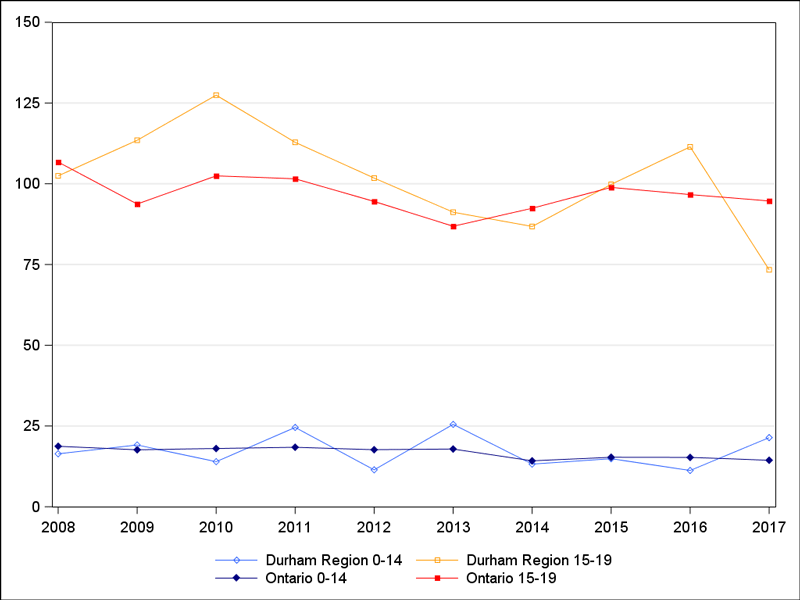
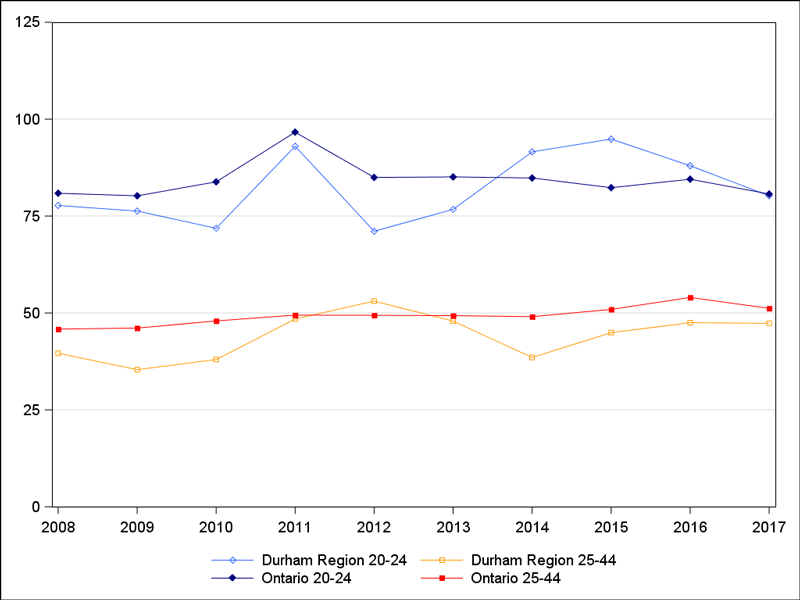
  • Age-specific pedestrian-related ED visits rates in individuals aged 0 to 14 years, 15 to19 years, 20 to 24 years and 25 to 44 years

Age-standardized ED visit rate

An age-standardized ED visit rate is the number of ED visits per 100,000 that would occur if the population had the same age distribution as the 2011 Canadian population. This rate provides a single summary number that allows populations with different age compositions to be compared.

Age-specific ED visit rate

This rate is the total number of ED visits in a specified age group per 100,000 population in that age group. The numerator and denominator refer to the same age group.

For more information

Contact us

Health Department
The Regional Municipality of Durham
605 Rossland Road East
Whitby, Ontario L1N 6A3
Telephone (within regional limits): 311
Fax: 905-666-6214
Email the Health Department
Map this location

Sign up to our Newsletter

Stay up to date on the Region's activities, events, programs and operations by subscribing to our eNewsletters.