
Cannabis-Related Hospitalizations and Emergency Department Visits at a Glance
Release date: December 2018
Highlights
- This report demonstrates the burden of cannabis use on the health system by examining the rates of cannabis-related hospitalizations and emergency department (ED) visits in Durham Region residents.
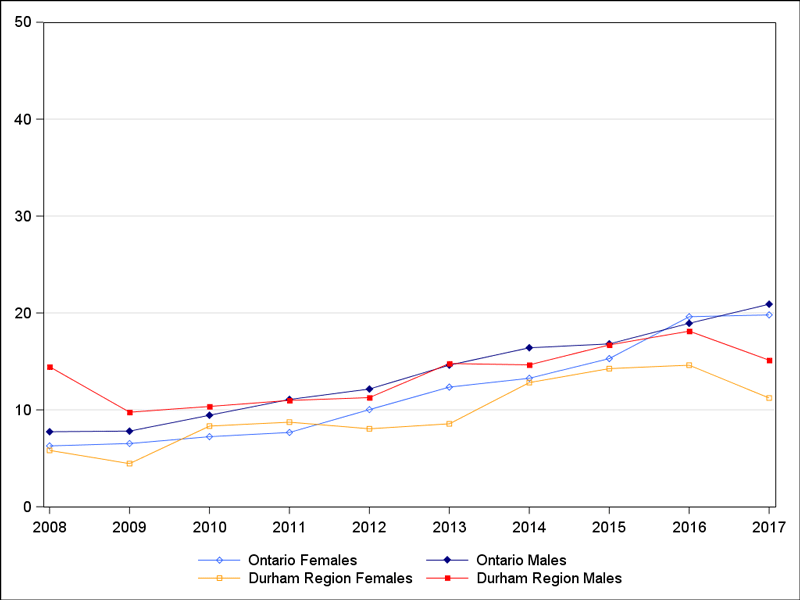
- Between 2008 and 2017, the rate of cannabis-related hospitalizations increased in males and in females in Durham Region and Ontario. However; in the past two years, the rate of increase slowed in Ontario while Durham Region’s rates declined between 2016 and 2017. In 2017, there were 90 cannabis-related hospitalizations in Durham Region residents.
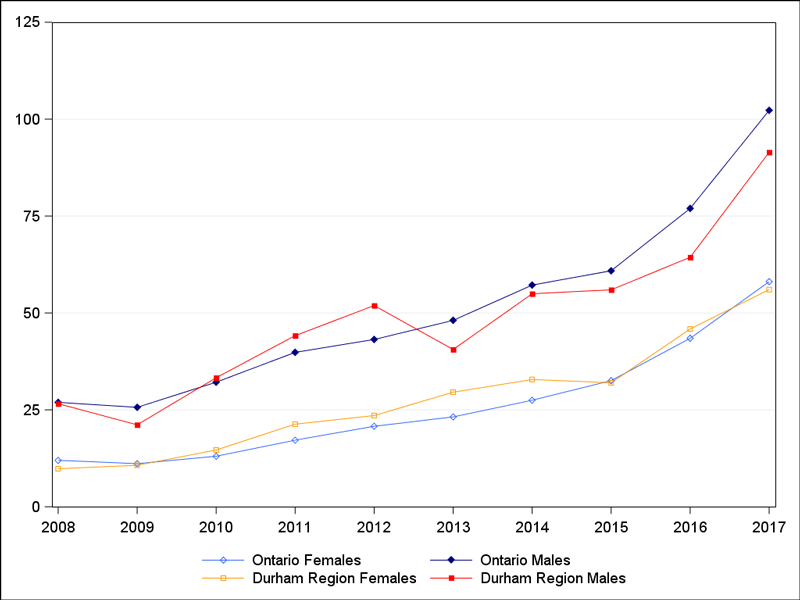
- The rate of cannabis-related ED visits also showed a steady increase between 2008 and 2017 in Durham Region and Ontario. By 2017, there were 504 cannabis-related ED visits in Durham Region residents.
- Hospitalization and ED visit rates were consistently higher in males than females.
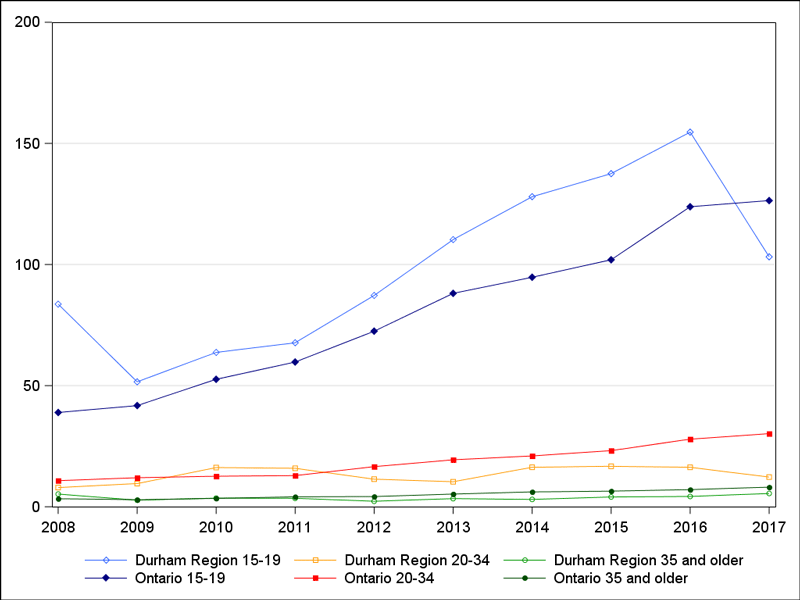
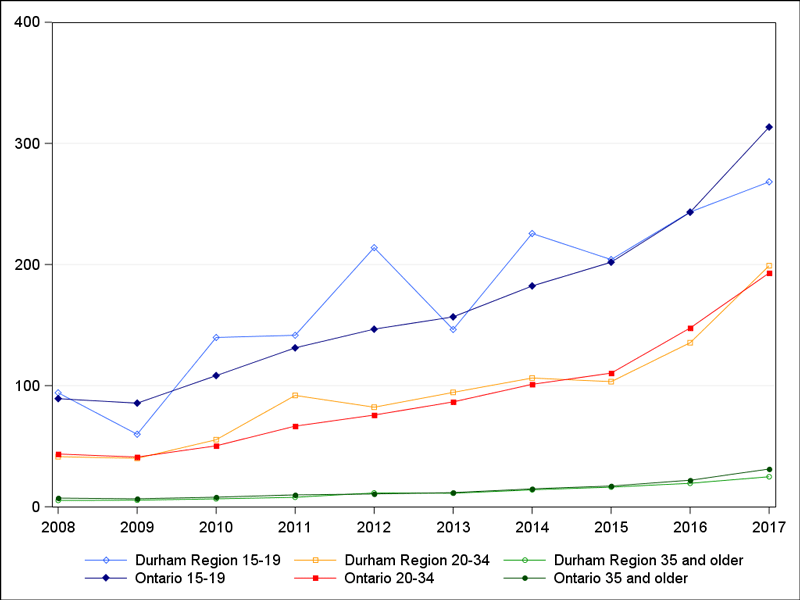
- The rates in youth aged 15 to 19 were consistently higher than any other age group. Durham Region youth accounted for half of the hospitalizations and almost one-quarter of the ED visits in 2017. Cannabis-related hospitalization rates in Durham Region youth were consistently higher than provincial rates.
- Durham Region residents aged 20 to 34 had the second highest rate of cannabis-related ED visits, accounting for over half of the ED visits in 2017.
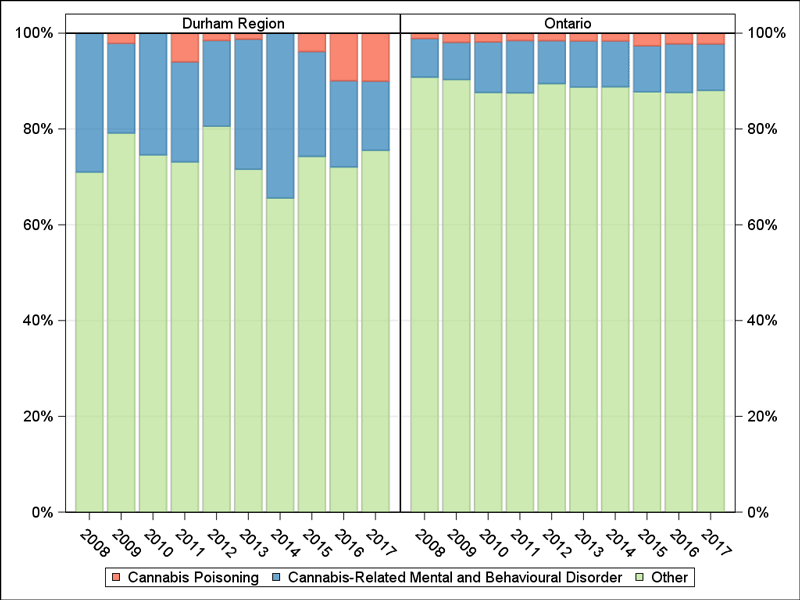
- One-in-ten (10%) of the hospitalizations was due to cannabis poisoning while 14% were due to mental and behaviour disorders related to cannabis use, such as intoxication, harmful use and dependence. In the remaining 76% of hospitalizations, cannabis was not the most responsible diagnosis for the hospitalization but was listed as a comorbidity.
Figure 1: Age-standardized cannabis-related hospitalization rates per 100,000 in Durham Region and Ontario, by sex, between 2008 and 2017
| Data table for figure 1 | ||||||||||||||||||||||||||||||||||||||||||||||||||||||||||||||||||||||||||||||||||||||||||||||||||||||||||||||||||||||||
|
||||||||||||||||||||||||||||||||||||||||||||||||||||||||||||||||||||||||||||||||||||||||||||||||||||||||||||||||||||||||
Figure 2: Age-standardized cannabis-related ED visit rates per 100,000 in Durham Region and Ontario, by sex, between 2008 and 2017
| Data table for figure 2 | ||||||||||||||||||||||||||||||||||||||||||||||||||||||||||||||||||||||||||||||||||||||||||||||||||||||||||||||||||||||||
|
||||||||||||||||||||||||||||||||||||||||||||||||||||||||||||||||||||||||||||||||||||||||||||||||||||||||||||||||||||||||
Figure 3: Age-specific cannabis-related hospitalization rates per 100,000 in Durham Region and Ontario, individuals aged 15 to 19, 20 to 34 and 35 years and older, between 2008 and 2017
| Data table for figure 3 | ||||||||||||||||||||||||||||||||||||||||||||||||||||||||||||||||||||||||||||||||||||||||||||||||||||||||||||||||||||||||||||||||||||||||||||||||||||||||||||||||||||
|
||||||||||||||||||||||||||||||||||||||||||||||||||||||||||||||||||||||||||||||||||||||||||||||||||||||||||||||||||||||||||||||||||||||||||||||||||||||||||||||||||||
Figure 4: Age-specific cannabis-related ED visit rates per 100,000 in Durham Region and Ontario individuals aged 15 to 19, 20 to 34 and 35 years and older, between 2008 and 2017
| Data table for figure 4 | ||||||||||||||||||||||||||||||||||||||||||||||||||||||||||||||||||||||||||||||||||||||||||||||||||||||||||||||||||||||||||||||||||||||||||||||||||||||||||||||||||||
|
||||||||||||||||||||||||||||||||||||||||||||||||||||||||||||||||||||||||||||||||||||||||||||||||||||||||||||||||||||||||||||||||||||||||||||||||||||||||||||||||||||
Figure 5: Per cent of most responsible diagnosis codes, by diagnosis category, in Durham Region and Ontario between 2008 and 2017
| Data table for figure 5 | ||||||||||||||||||||||||||||||||||||||||||||||||||||||||||||||||||||||||||||||||||||||||||||
|
||||||||||||||||||||||||||||||||||||||||||||||||||||||||||||||||||||||||||||||||||||||||||||
Data Sources
Hospitalization and ED visit data are collected by the Canadian Institute for Health Information (CIHI) on a fiscal year basis. For hospital visits, the main diagnostic code is the “most responsible diagnosis” (MRD) that is deemed to be the clinically significant reason for the visit. For ED visits, the main diagnostic code is the “main problem” (MP). Hospitalization and ED visit data provide only a crude measure of the burden of cannabis use. Data are influenced by factors that are unrelated to health status such as availability and accessibility of care, administrative policies and hospital procedures. This may influence comparisons between areas and over time.
For all indicators, data were analyzed by the residence of the patient, not where the hospitalization or ED visit occurred. Ontario residents treated outside of the province were excluded. Data were reported by calendar year, based on the year of the hospitalization or ED visit. This report includes hospitalization and ED visit indicators with relevance to public health programming.
Cannabis-related hospitalizations and ED visits were selected using ICD-10-CA codes T40 (.7) (i.e., poisoning) and F12 (.0-.9) (i.e., mental and behavioural disorders due to acute intoxication, harmful use, dependence, etc. from the use of cannabinoids) whether it was the MRD/MP or comorbidity. This excludes injuries such as from motor vehicle traffic crashes or chronic conditions such as cancer where cannabis may be a contributing factor. Hospitalizations to designated adult mental health hospital beds were not included in this analysis. ED visits where the health care provider documented uncertainty in the diagnosis (diagnosis prefix Q) and ED visits that resulted in a transfer to another ambulatory care facility were included in the counts. Hospitalization and ED visits for mental and behavioural disorders due to multiple drug use (F19) were excluded. Multiple codes can exist for each hospitalization or ED visit. As such, a unique visit number, DAD key (hospitalizations) or NACRS key (ED visits), was used to count the number of hospitalizations or visits where at least one of the above codes was captured as the MRD/MP or comorbidity. In Figure 5, there is no distinction between prescription and illegal cannabis use.
Definitions
Figures and tables are provided for the following indicators:
- Age-standardized cannabis-related Hospitalization and ED visit rates by sex
- Age-specific cannabis-related Hospitalization and ED visits rates in individuals aged 15 to19 years, 20 to 34 years and 35 years and older
Age-standardized Hospitalization/ED visit rate
An age-standardized Hospitalization/ED visit rate is the number of Hospitalization/ED visits per 100,000 that would occur if the population had the same age distribution as the 2011 Canadian population. This rate provides a single summary number that allows populations with different age compositions to be compared.
Age-specific Hospitalization/ ED visit rate
This rate is the total number of Hospitalizations/ED visits in a specified age group per 100,000 population in that age group. The numerator and denominator refer to the same age group.
For more information
Focused Report - Cannabis-Related Emergency Department Visits
Statistics Canada’s Cannabis Stats Hub
Contact Us


